
“Maybe because it’s a more major road?”
“Or, because it’s closer to the freeway?”
“Doesn’t that [median] have palm trees? I bet it’s like birds or something dropping seeds.”
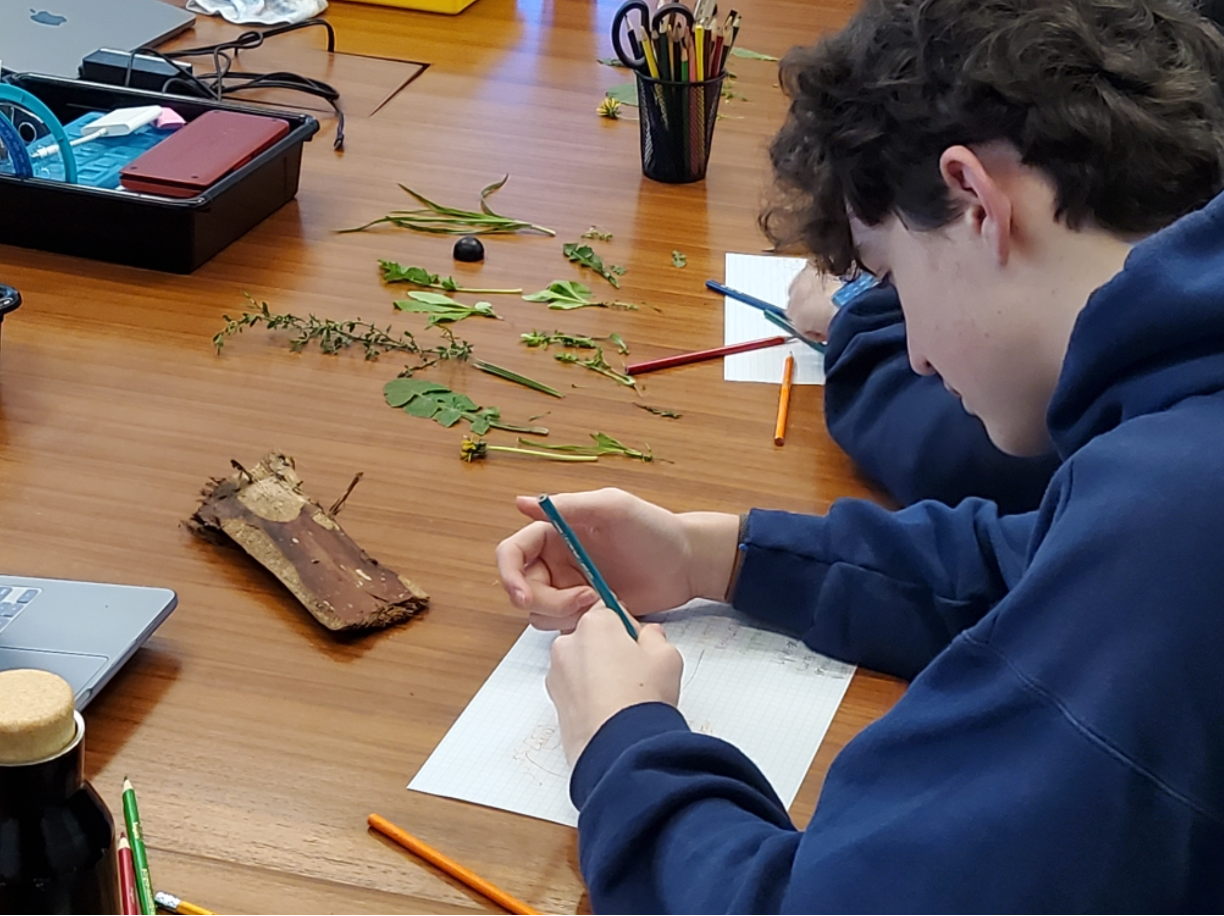
9th Grade Biochemists are conducting an ecological survey of the median strips right around our downtown campus, gathering measures of biodiversity and generating ideas to explain their findings. Using a quadrat tool (the same one their teacher used in his own graduate studies), students are following protocols to deliberately cover and select random samples from each entire median, but each cohort is using different methods! In one period, students each claimed a square quarter meter and pulled unique plant samples within, bringing them back to the classroom to identify and then calculate together the average number of unique species within each quadrat across the two medians (“Whoa, so this [median] is double as rich as that one. Did you guys also find this little baby grass?? It’s cute!”). In another, students walked ten paces, laid the quadrat, took a photo, then used their laptops to code each intersection on a grid with the type of cover at that point—rock, soil, herbaceous non-grass plant, or grass plant—generating comparisons in the mean percent groundcover type between the two medians.
Woah, so this [median] is double as rich as that one.
Authentic practice of these sampling methods gives students insight into a particular science field, helping them better understand papers they read and how conclusions and theories are generated in ecology. It also connects them to our city, generating palpable adoration, curiosity, and care for nearby plants, insects, and even storm drains and dirt. The practice also develops fluency across math and science domains by revisiting and applying previously learned information, like the species-area rule, different uses of mean, median and mode, and even the mathematical impact of random sampling (“Wait, how do we know it’s not just that we picked the greener ones?”). Finally, the collection of different data by the different class periods creates an authentic audience for their calculations and documentation, and puts students in conversation with each other about the findings and how they might connect. We’re a community of scientists!
This week students are also diagramming the biogeochemical cycles, connecting what they have learned so far about the ways carbon, oxygen, nitrogen, water and phosphorous cycle through photosynthesis, cellular respiration, anaerobic decomposition, extraction, refinement and combustion, and even how nitrogen based fertilizers are made (Haber-Bosch process). As they diagram and label, they revisit chemical notations and equations, see connections between them, and travel from the “just under your nose” science to a big picture overview.